

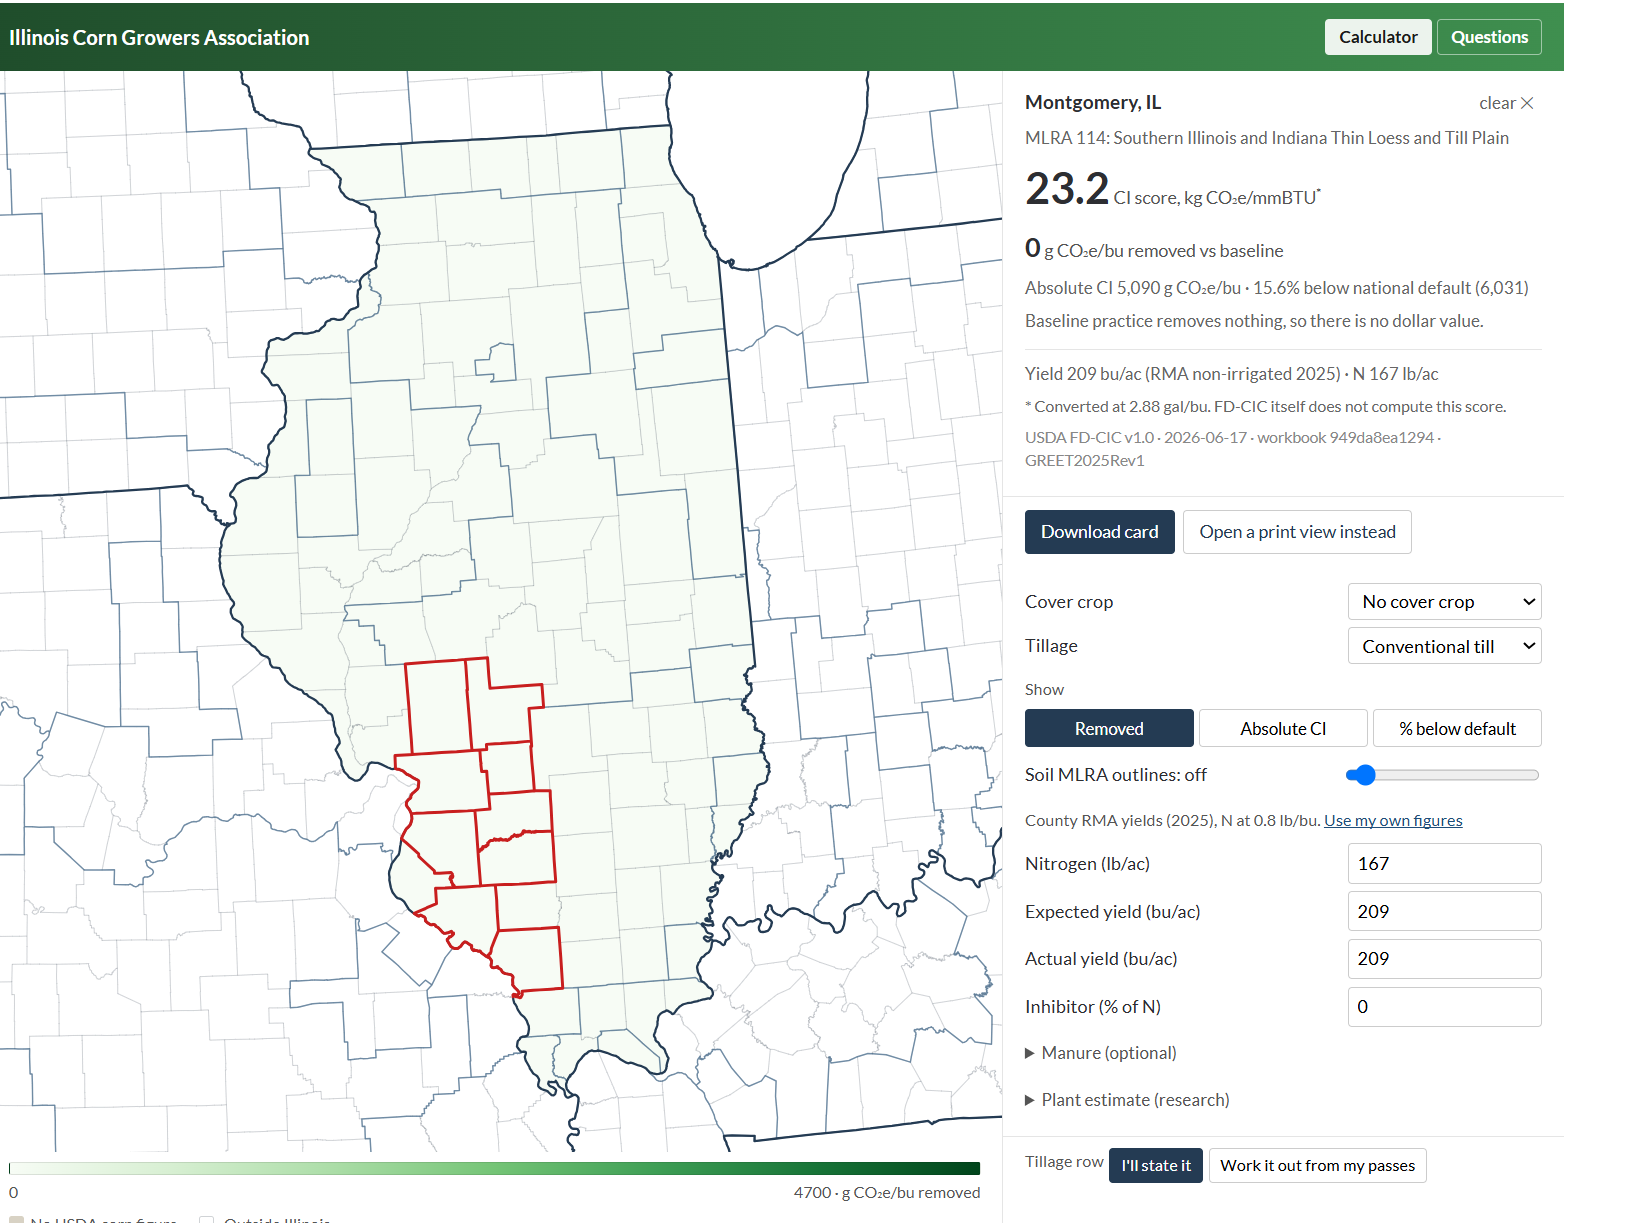
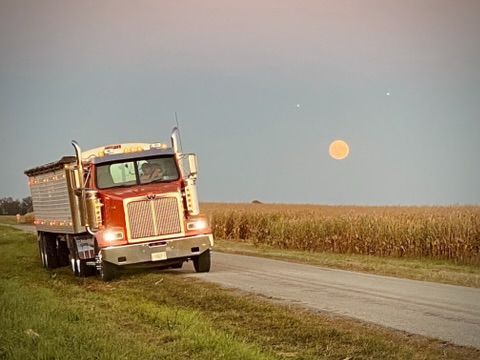
President Trump and U.S. Secretary of Ag Brooke Rollins announced that the USDA is rolling out an $8 billion Harvest Fuel Relief Program to provide one-time payments to farmers.
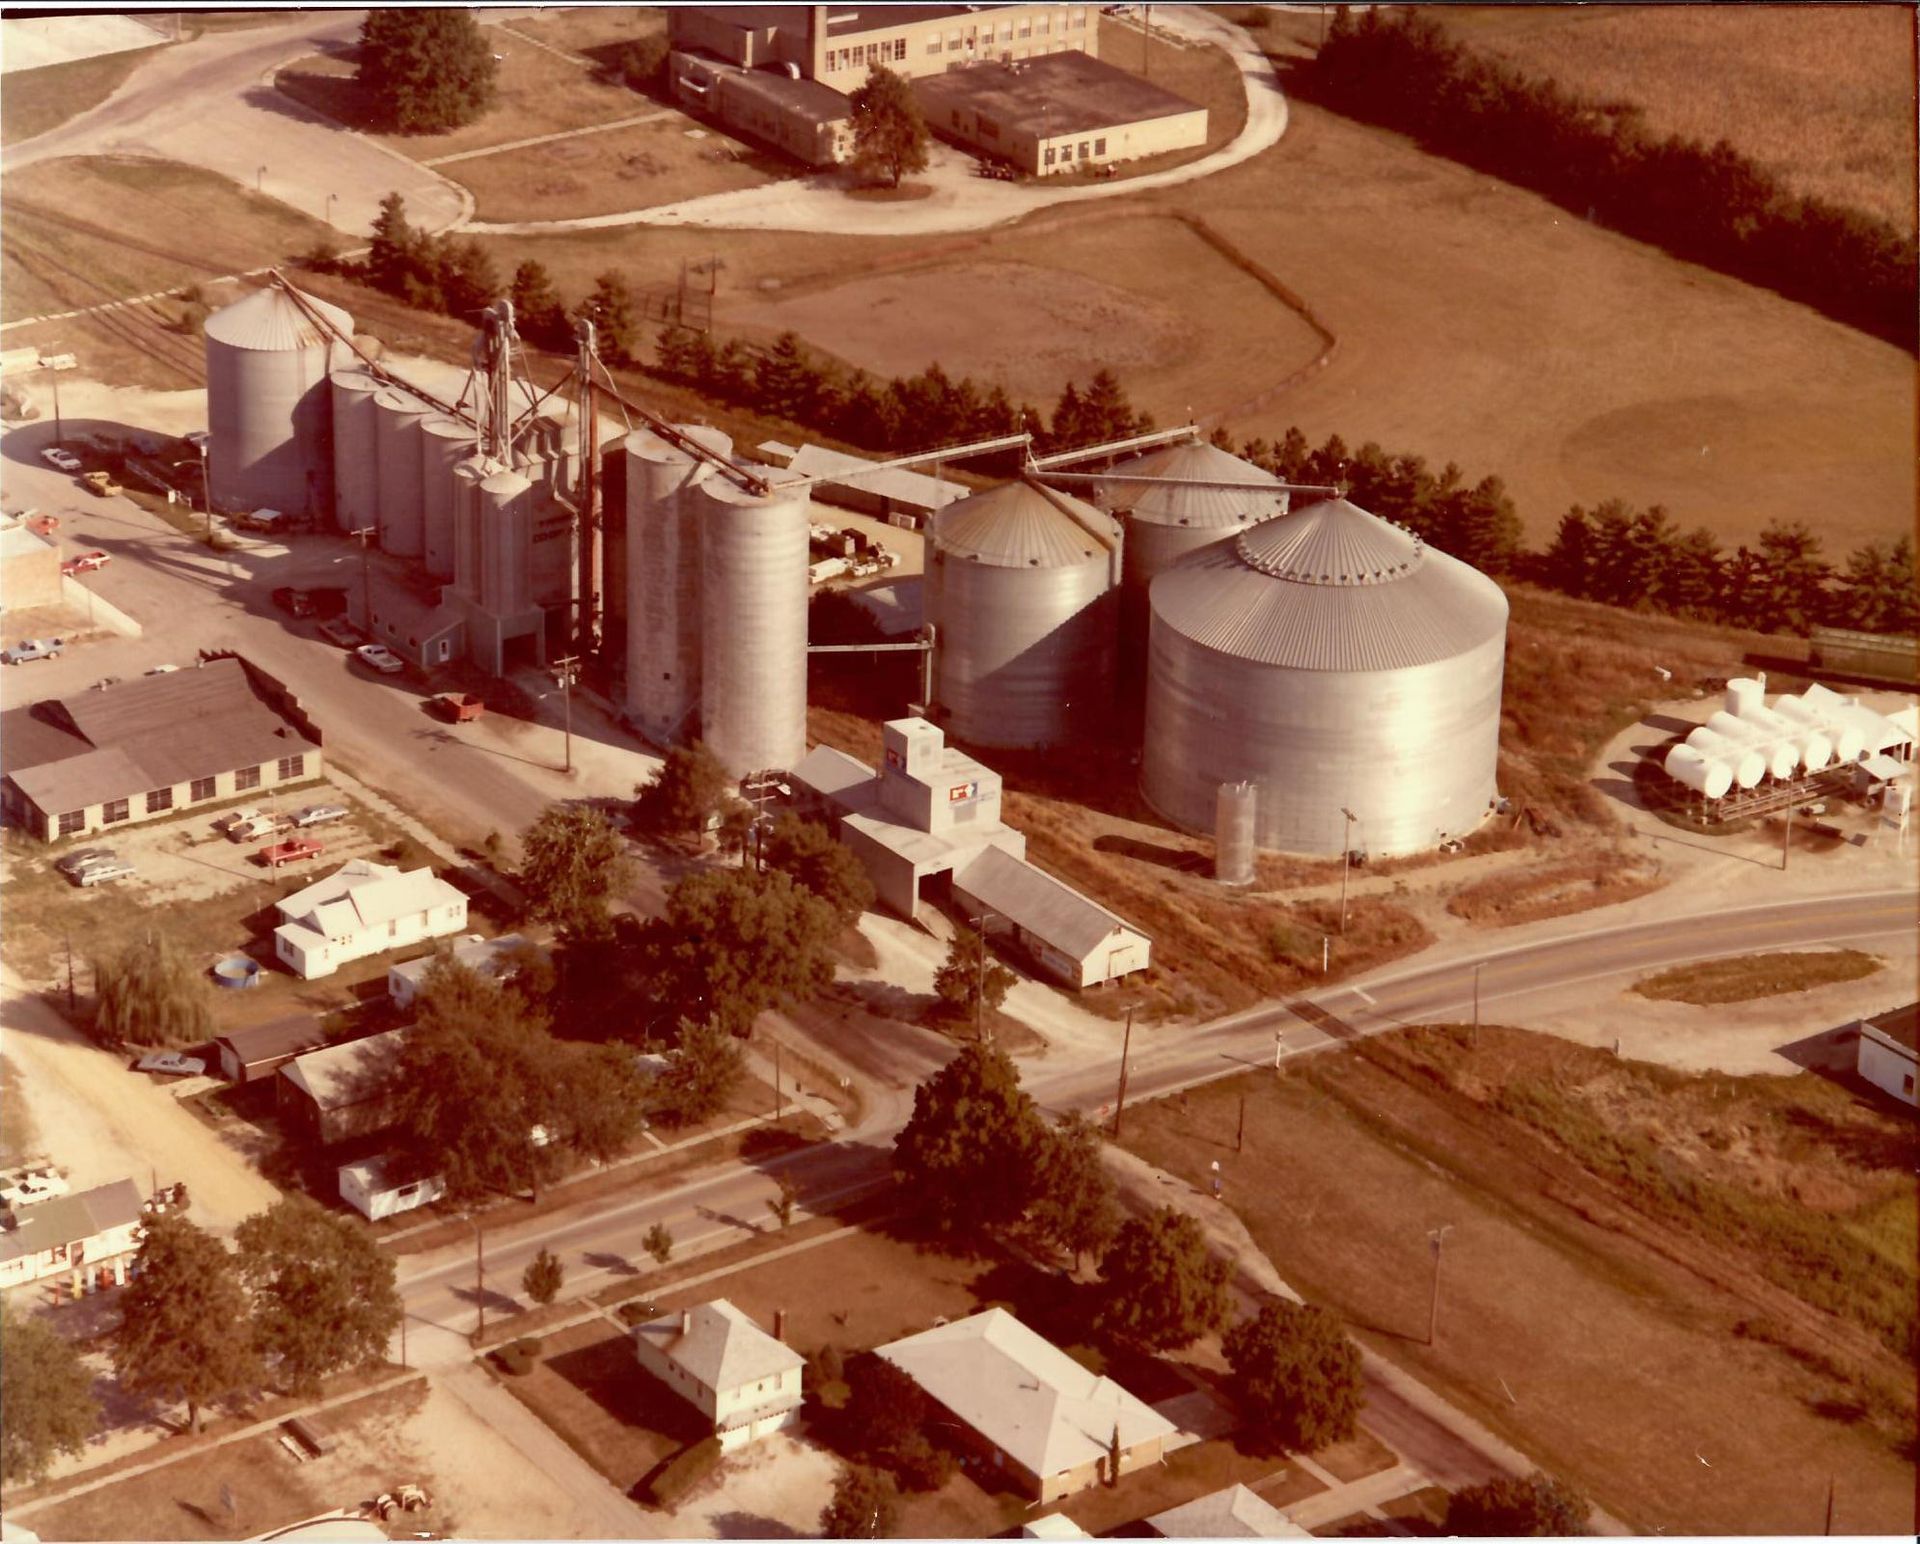
Farmers Co-op in Varna grew from 900,000 to 16.4 million bushels of storage. Watch the video from our Elevator Appreciation Lunch visit.
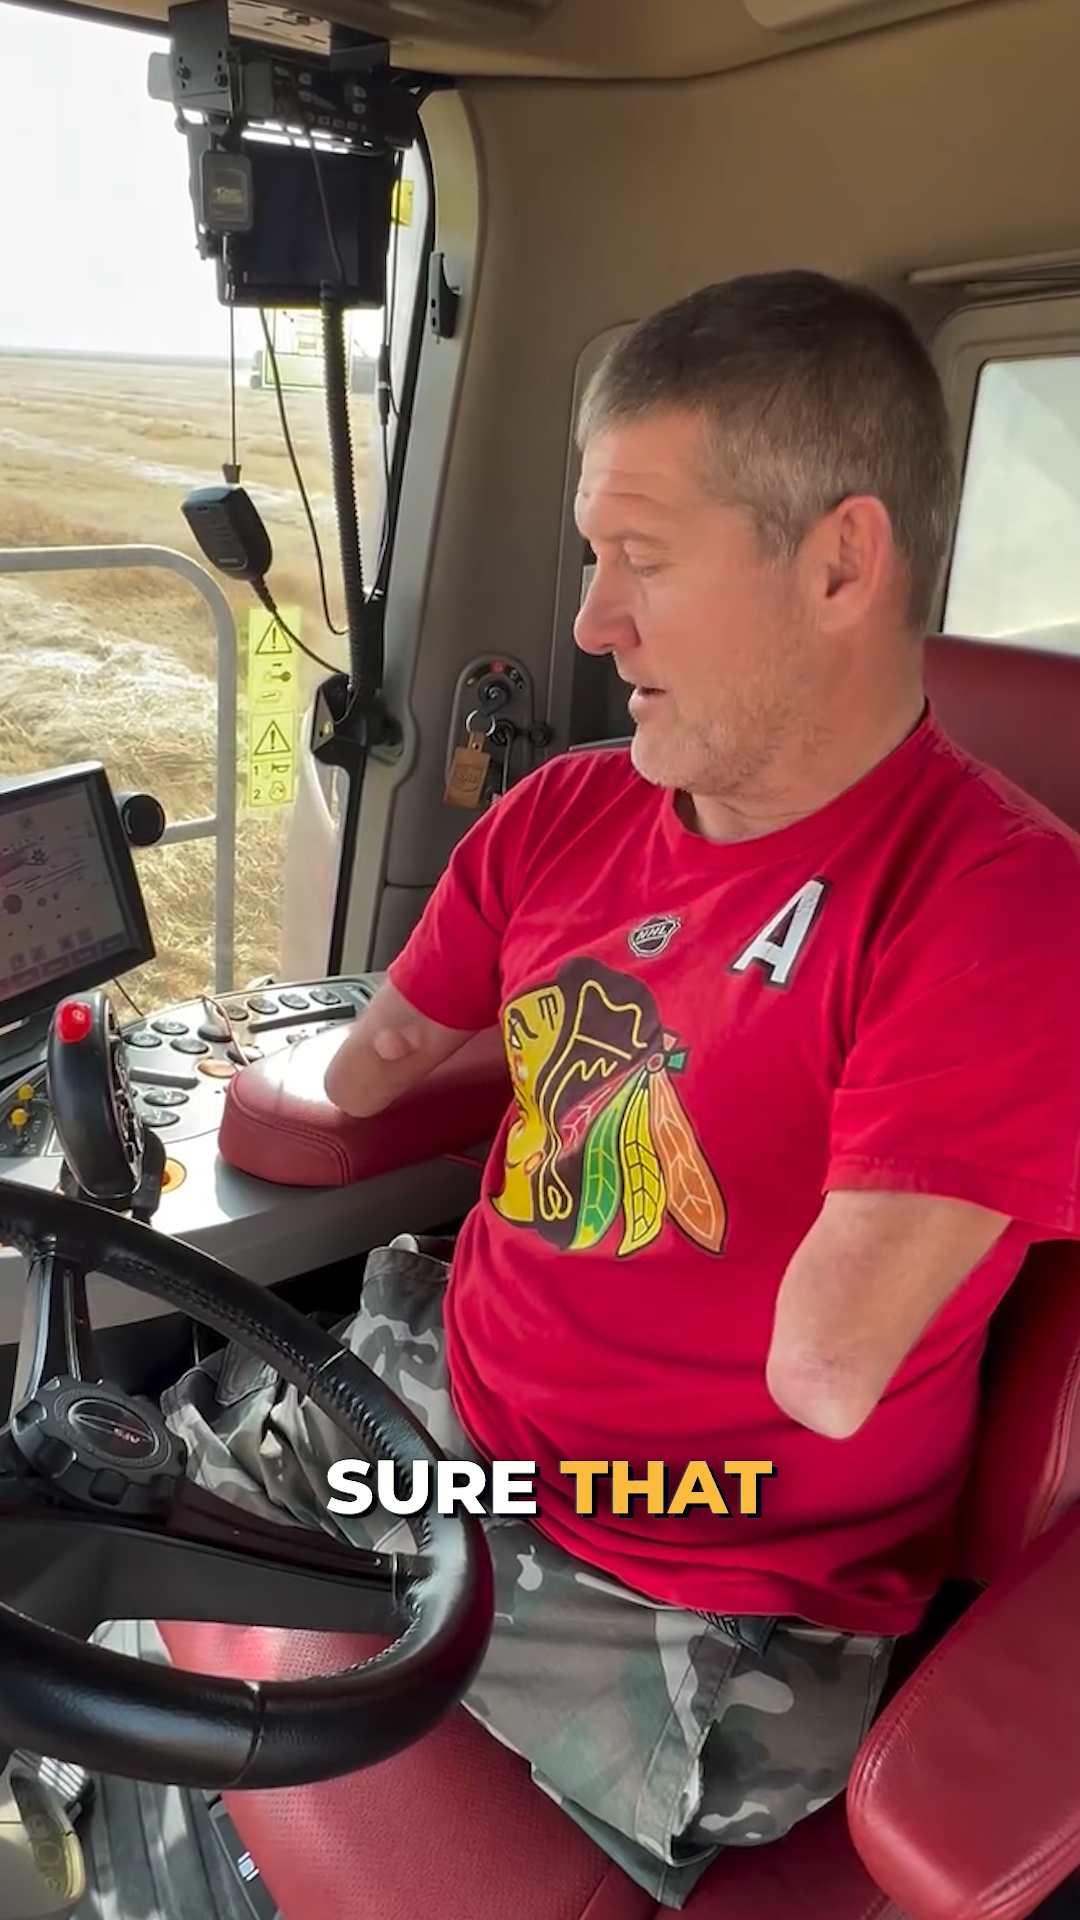
Farmer Chris Koch, born without arms or legs, joins IL Corn TV to talk harvest, hard years and why he fears regret more than failure.
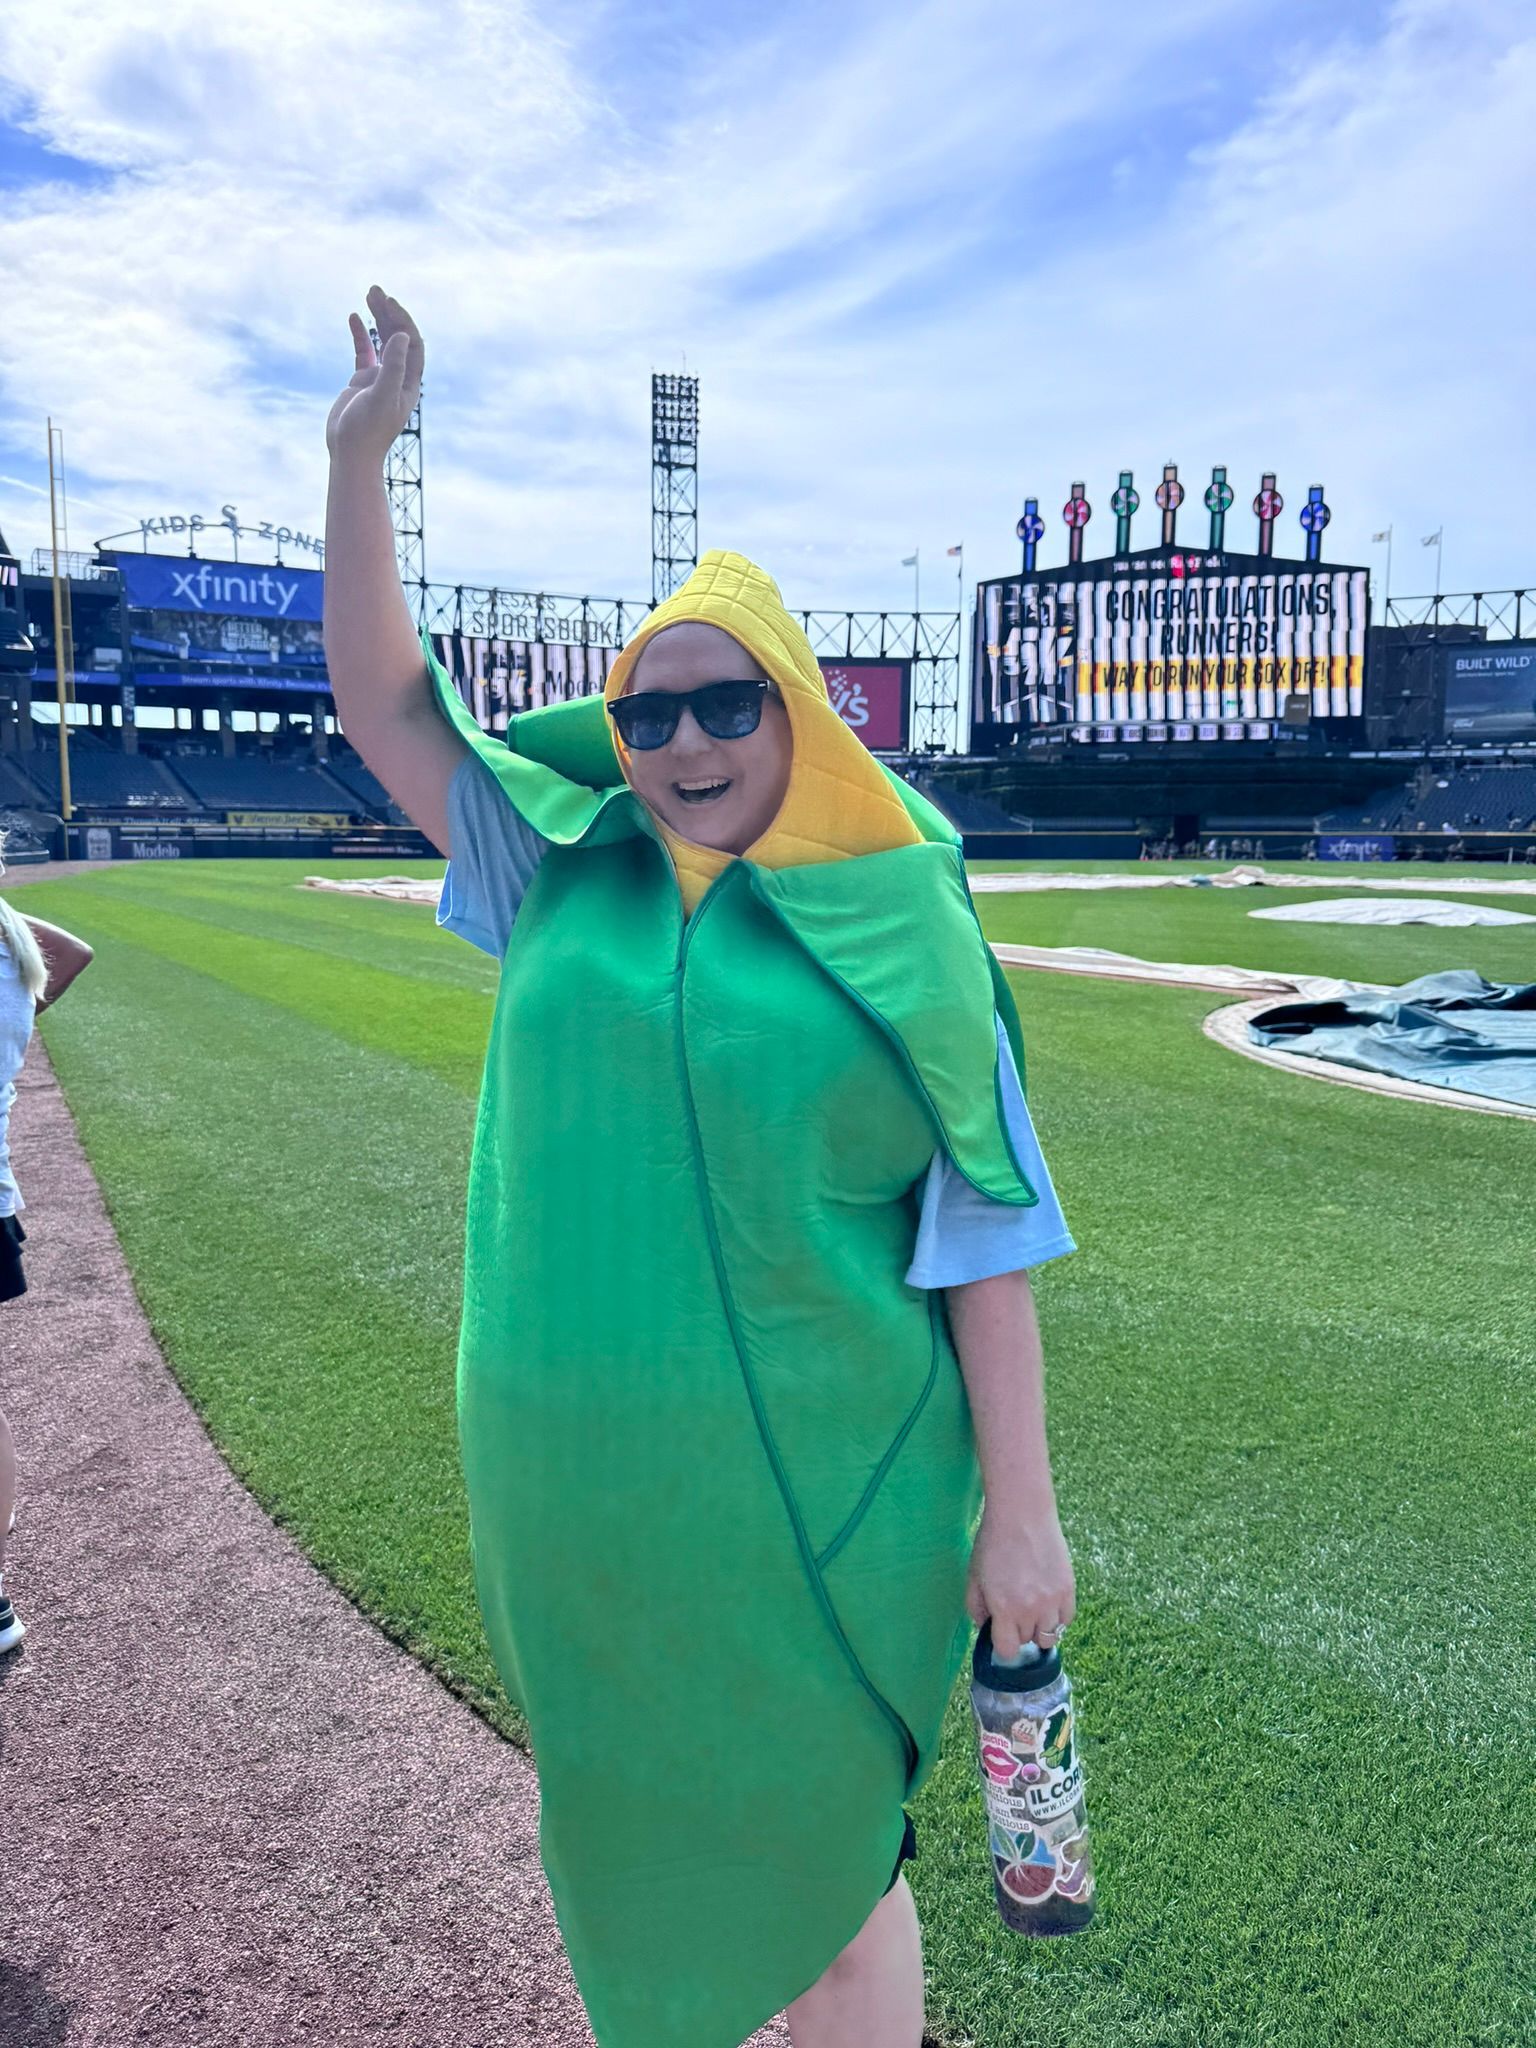
Five years at IL Corn with farming, farmers, corn, and storytelling—with a few hot dogs, viral videos, and plenty of Midwestern waves.
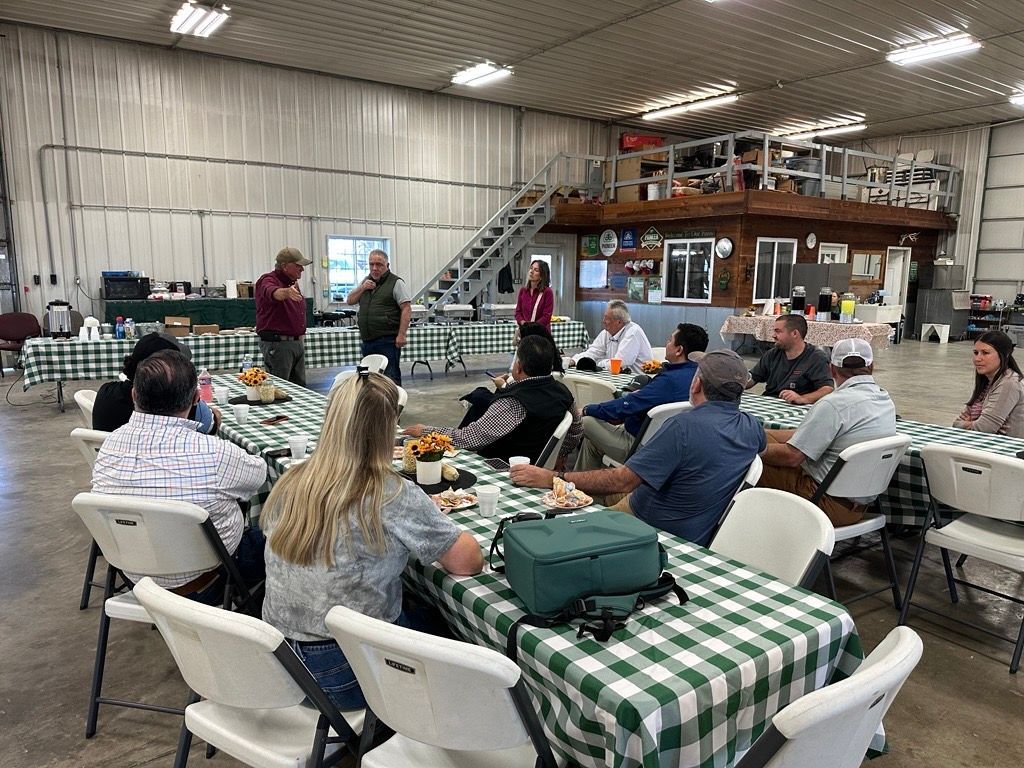
IL Corn & USGBC hosted Mexican masa millers on southern Illinois farms and river terminals, strengthening ties with our top corn customer.
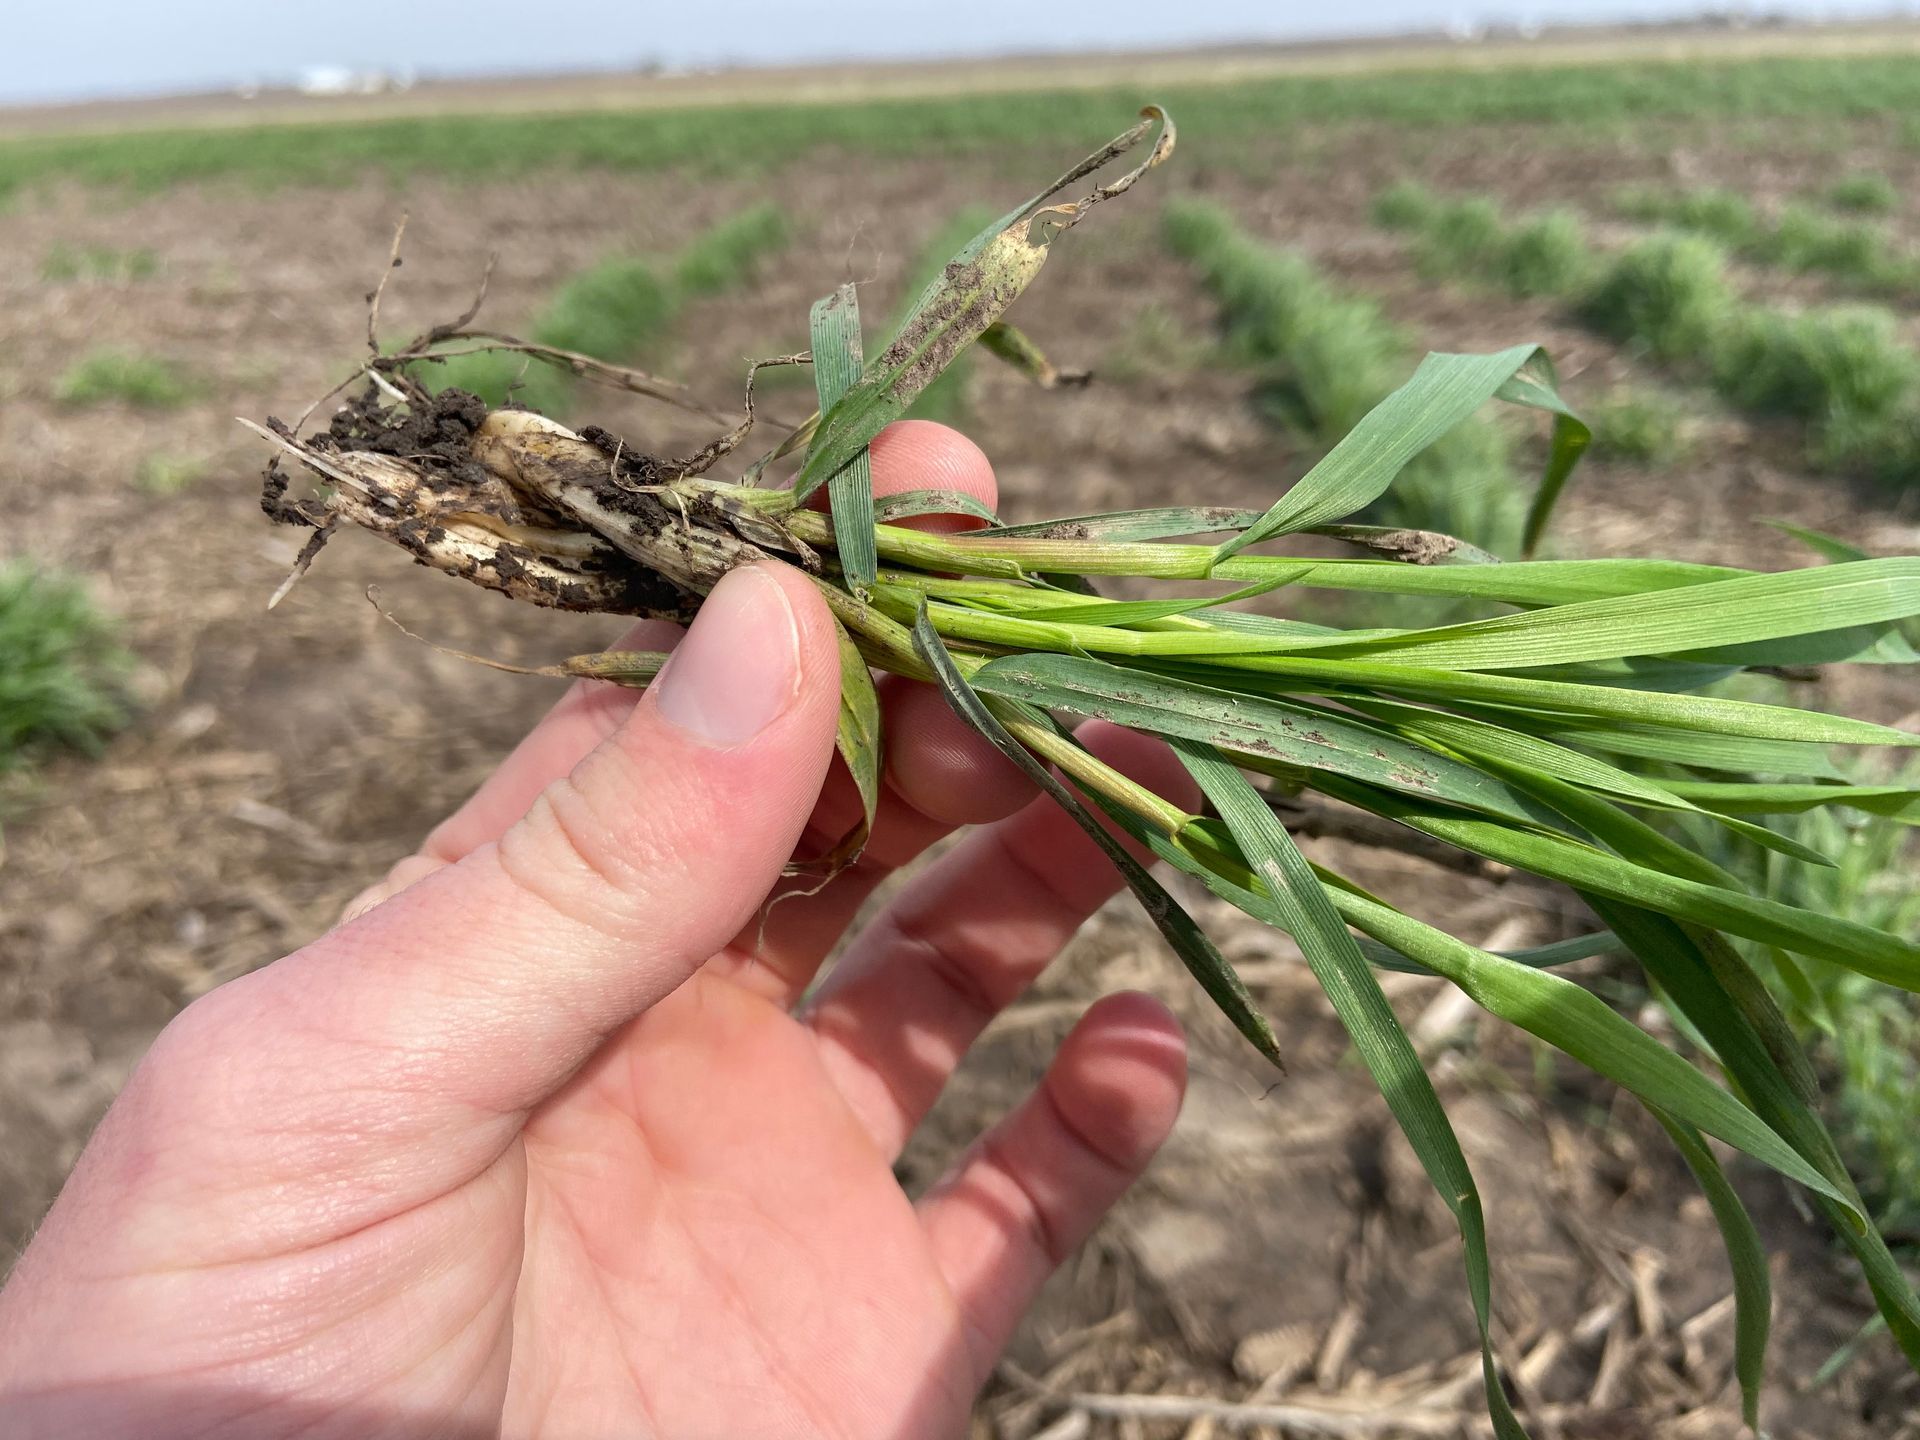
Pre-enrollment opens Nov. 30 for IDOA’s Fall Covers for Spring Savings program, worth up to $5/acre off 2027 crop insurance premiums.
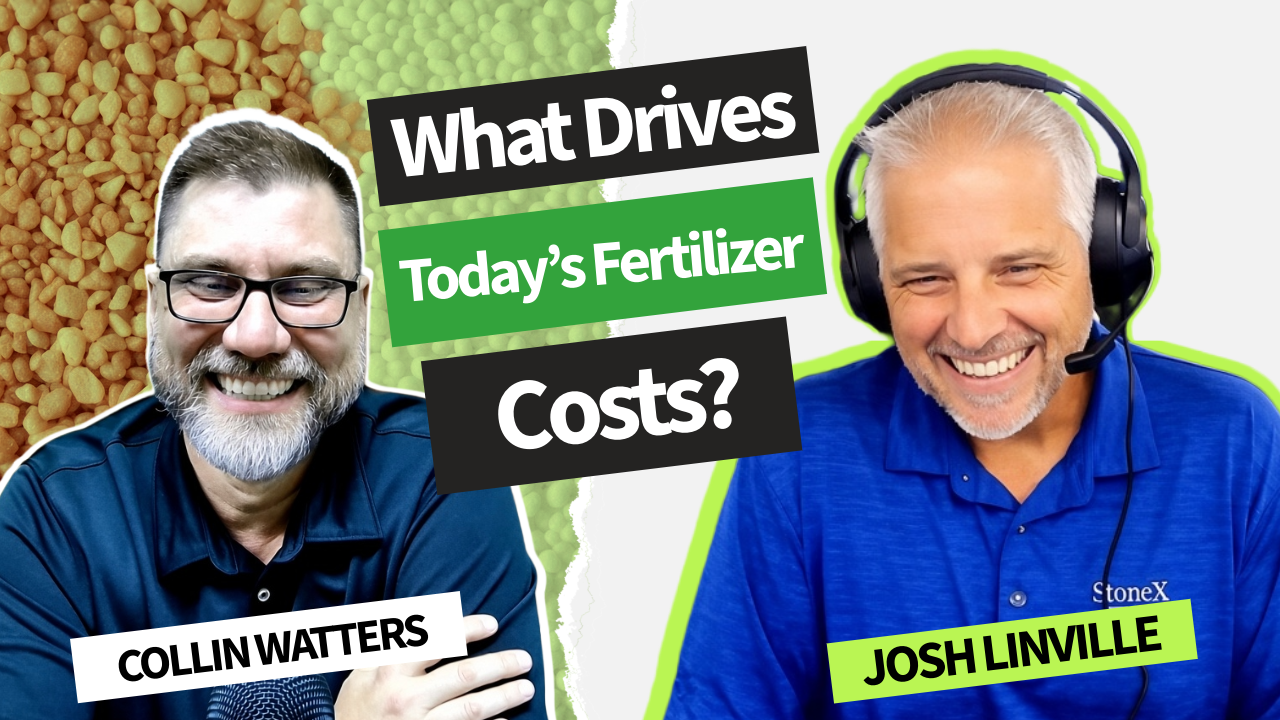
What’s really driving your fertilizer bill? StoneX’s Josh Linville breaks down global supply, competition, and the long-term fix on IL Corn TV.
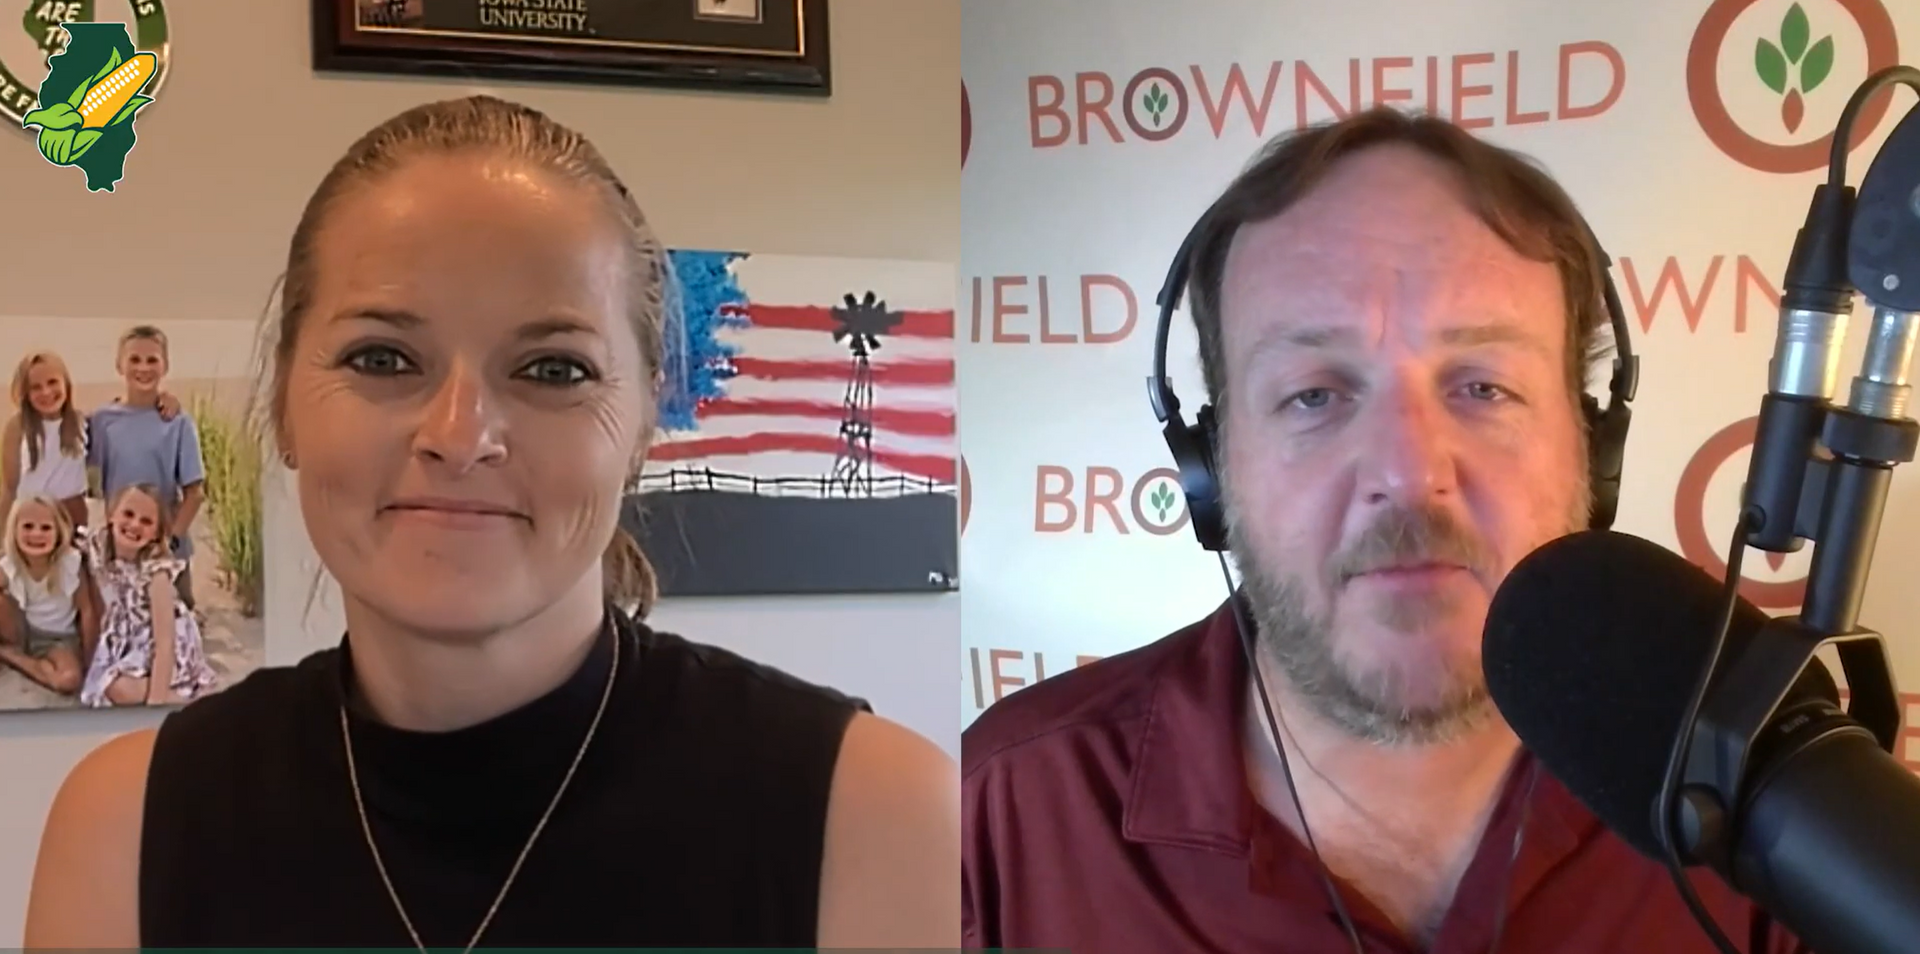
Illinois Corn and U of I built lease addenda to help farmers and landowners build cover crops, soil health and nutrient goals into rental agreements.
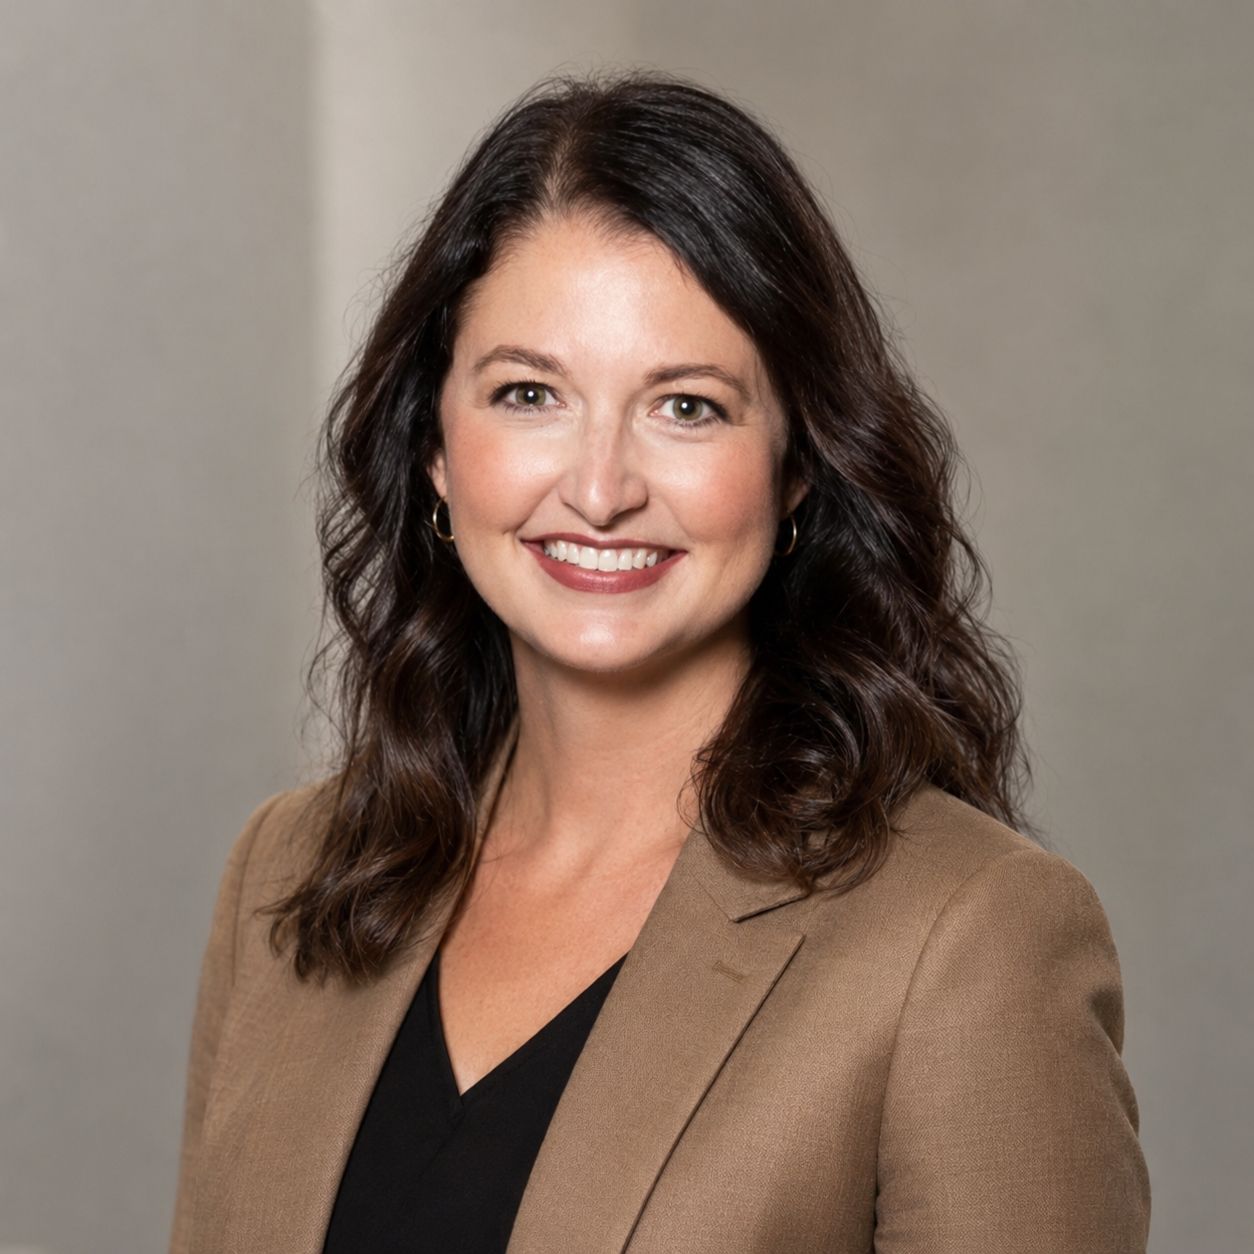
Jenny Webb has spent her career in Illinois agriculture. Now she’s about three months into a new job as president of the Illinois Fertilizer & Chemical Association (IFCA), the group that represents the ag retailers, applicators and suppliers who get fertilizer and crop protection products to your farm when you need them. Webb came to IFCA from Illinois Farm Bureau. She’s new to the fertilizer and chemical side of the business, but not to farmers or to the policy and regulatory issues that affect them. IL Corn sat down with her to talk about what she’s learned so far, the issues facing Illinois ag retailers, and why the work happening behind the scenes deserves more credit than it gets.
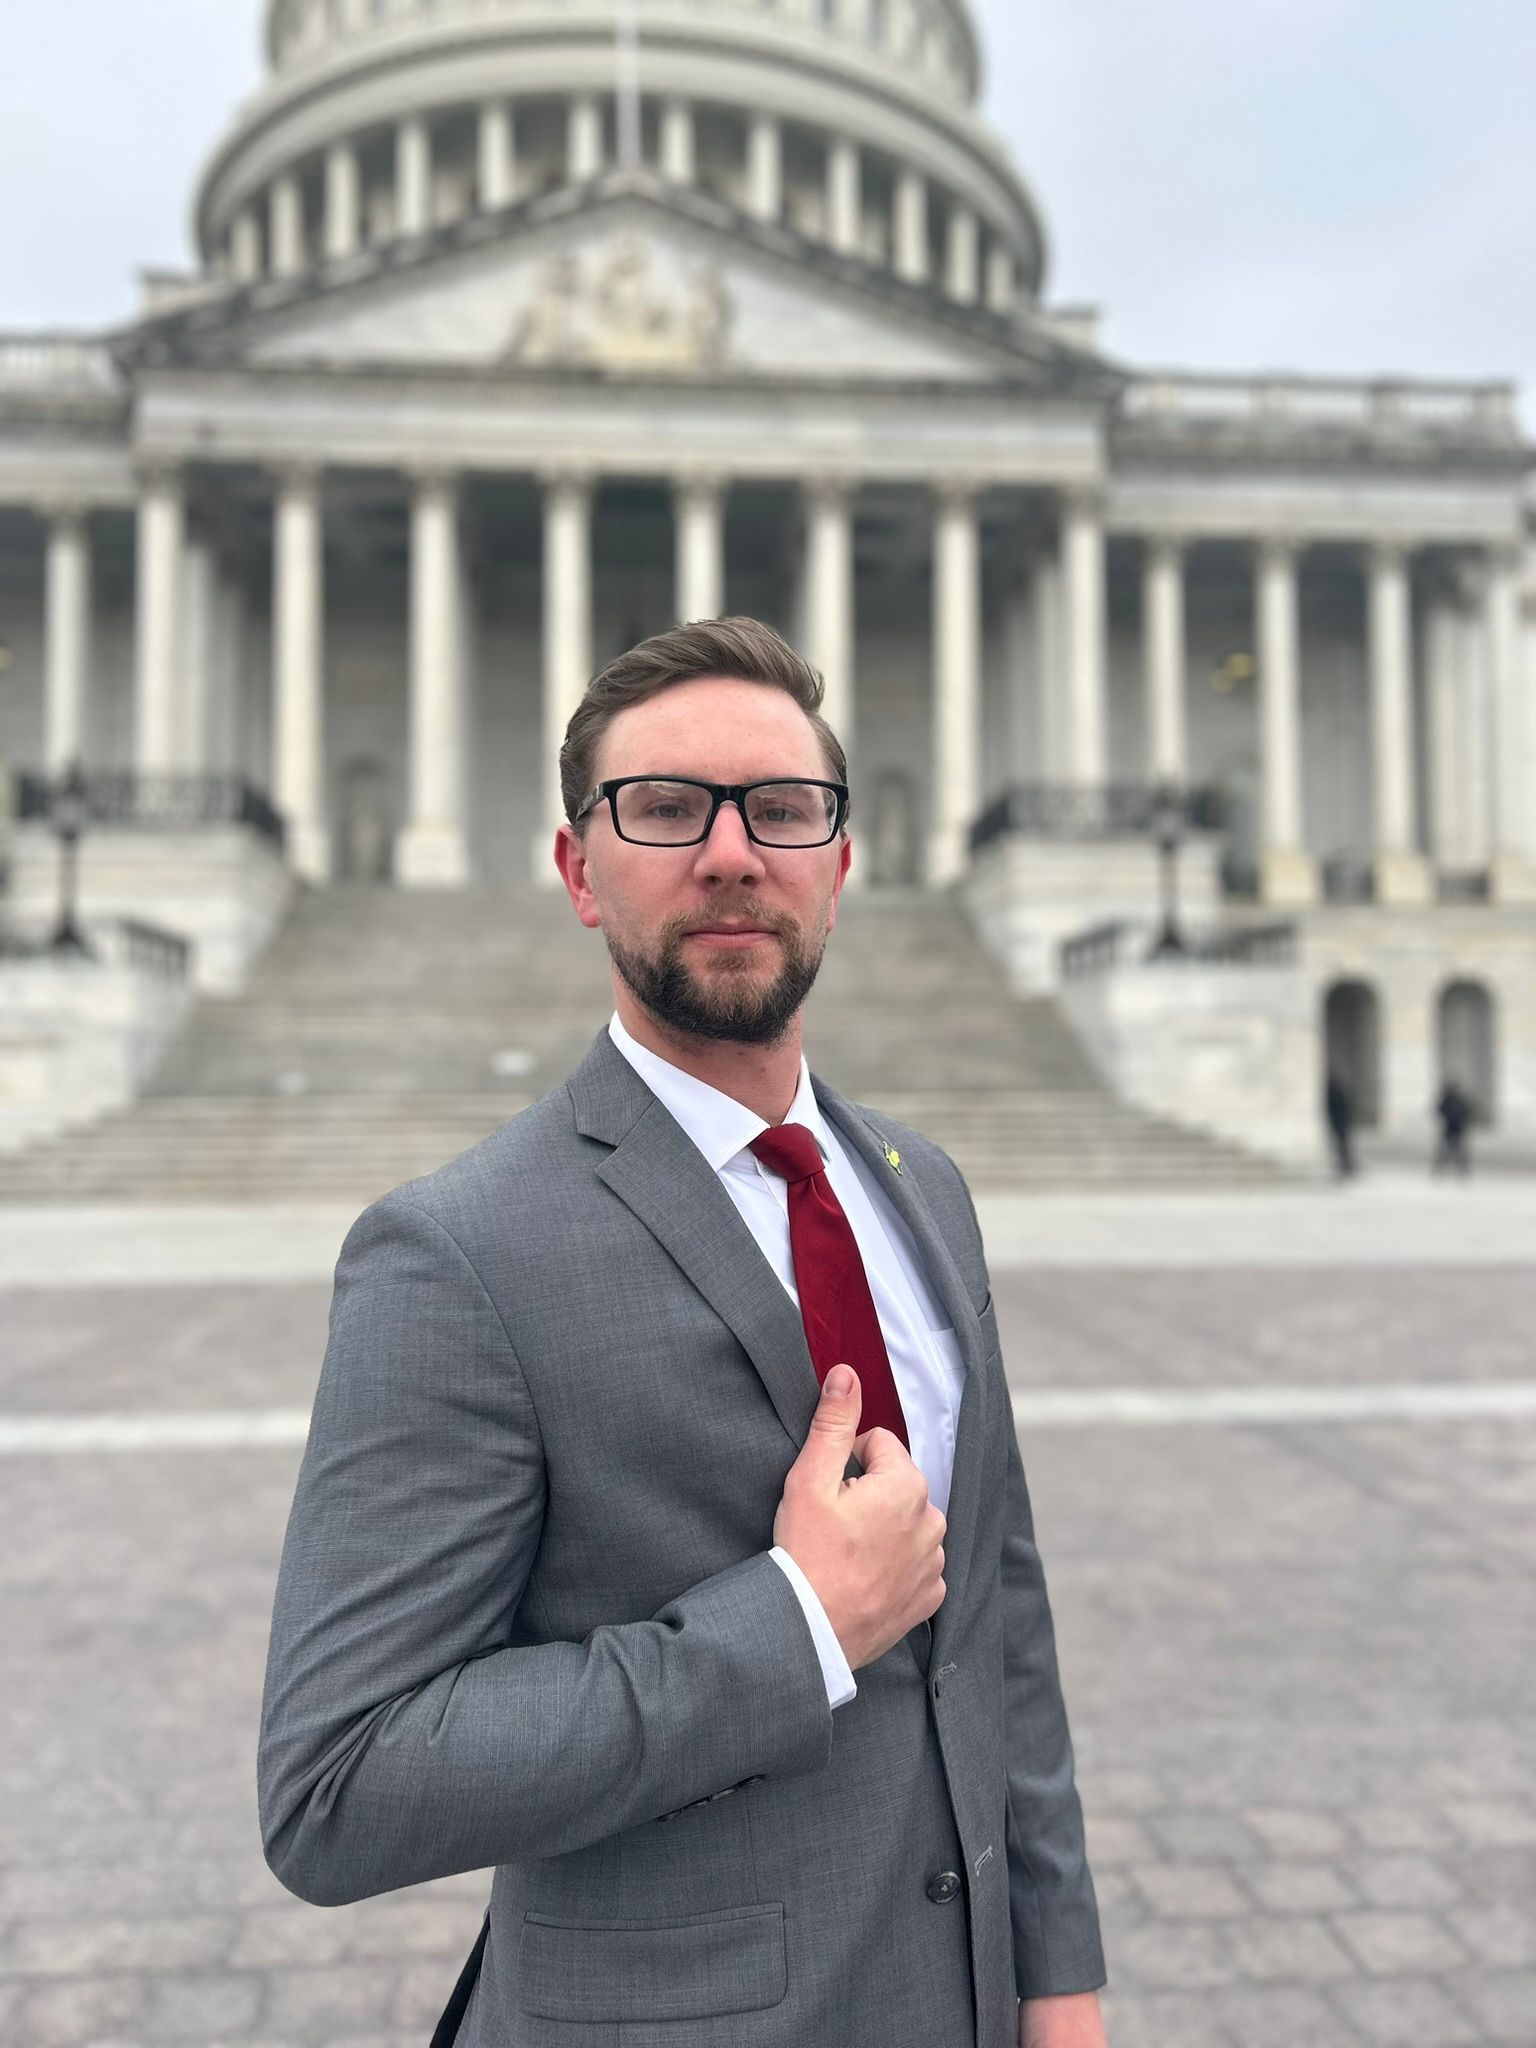
A sixth-generation farmer from Chenoa, IL, Andrew Jolly is carrying on his family’s farming legacy while learning how to make his voice heard in agricultural policy as a 2026 GROW participant.